71 patients 03.02.19-25.09.19 examined by brain MRI+angiography according to protocol [1]:
Neuro MR-protocol:
• axial T2 spin-echo
• axial T2 fluid-attenuated inversion recovery (FLAIR)
• sagittal T2 fast-spin-echo (FSE)
• coronal T1 FLAIR
• 3D time-of-flight (TOF) gradient-echo (GRE)
Liquor spaces, reflecting the degree of atrophic changes were measured in each patient (fig 1).
Cerebral measurements parameters:
• Cerebral atrophy: maximal width of convex sulcus on Ax T2 + parietal space on Sag T2 (mm).
• Cerebellar atrophy: maximal width of cerebellar sulcus + сerebellopontine cistern (mm).
• Cisternal atrophy: maximal Superior cerebellar cistern width + Interpeduncular cistern (mm).
• Internal atrophy: ventricular-cranial index (VCI) - anterior ventricles horns width/inter-temporal dimension (in percent)
![](https://epos.myesr.org/posterimage/esr/ecr2020/153777/media/847309?maxheight=300&maxwidth=300)
Fig. 1: Measuring sample. Cerebral atrophy: a) 
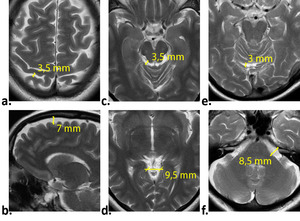
Ax T2 convex sulcus width. b) Sag T2 parietal space width. Cerebellar atrophy: с) Сerebellar sulcus width. d) сerebellopontine cistern width. Cisternal atrophy: e) Superior cerebellar cistern width. f) Interpeduncular cistern width.
Vascular brain changes graded by levels by scale (table 1), (fig 2).
Brain vascular changes scale. Table 1
changes |
level |
Single vascular foci on T2 FLAIR up to 3 |
1 |
Single foci from 3 to 10 |
2 |
Multiple foci more than 10 |
3 |
Leukoaraiosis +-foci |
4 |
lacunar cyst |
5 |
Post-stroke changes |
6
|
![](https://epos.myesr.org/posterimage/esr/ecr2020/153777/media/847311?maxheight=300&maxwidth=300)
Fig. 2: Axial T2 FLAIR on different levels (a, b). Hyperintense vascular foci (arrows), periventricular leukoaraiosis (arrowhead).
Patients were asked to determine the level of headache in scores on a standard ten-point scale and fill out a questionnaire. The number of complaints was considered (table 2).
Patient questionnaire. Table 2
![](https://epos.myesr.org/posterimage/esr/ecr2020/153777/media/862741?maxheight=300&maxwidth=300)
Table 1
The data were statistically processed in Excel using descriptive statistics.